Your iThenticate/Crossref Similarirty Check guidance is moving!
We’re migrating our content to a new guides site. We plan to fully launch this new site later in July. You can preview the new site now. To help you get up to speed with the new guidance structure, please visit our orientation page .
Viewing Similarity Report statistics
- On your Administrator settings page, select Statistics from the Administrator side-panel to take you to the Statistics page.
-
On the Statistics page, select your license type and data source, and set a date range.
If you need help selecting your license type, data source, and date range, check out the Accessing account statistics guide.
- Then, with your license type, data source, and date range set, select the Similarity Report tab.

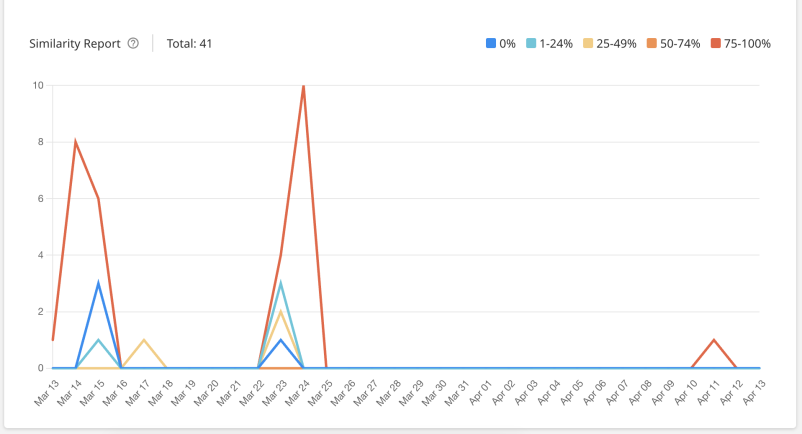
- Once you select the Similarity Report tab, the Similarity Report chart will appear. This chart is a visual representation of similarity ranges found for documents submitted to the account during the specified dates.
-
To view the number of your organization's Turnitin submissions that fell within similarity score range on a certain day, hover and move your mouse over the data line. Pop-ups will appear listing the submission numbers for each score range that correlate to the dates listed along the bottom of the chart.

Light blue: 0% matching text Dark blue: 1-24% matching text Yellow: 25-49% matching text Orange: 50-74% matching text Red: 75-100% matching text
Was this page helpful?
We're sorry to hear that
If you have the time, we'd love to know how we could improve it.
The guide
