Dashboard til risikovurdering af kontraktsnyd
Hvad er dashboardet?
Med udgangspunkt i klargøringen af din Turnitin Originality-konto analyserer Turnitin en elevs arbejde, hver gang de sender en opgave til din institution via Turnitin, forudsat at opgaven kan tilskrives den studerende. Ved hjælp af vores forudsigelsesalgoritme tilskriver vi den studerende en forudsigelsesscore. Hvis den studerende har en score, som vi anser for høj nok til at berettige yderligere undersøgelse, vil vi føje dem til dit dashboard til risikovurdering af kontraktsnyd.
Dette betyder ikke, at disse studerende har begået nogen form for akademisk forseelse. Dashboardet fremhæver elever, hvis indsendelser er potentielt problematiske ifølge vores forudsigelsesalgoritme. Dette dashboard bør bruges som det første skridt i en større undersøgelse.
Dashboard-indholdet viser ikke alle elever, der har indsendt til din Turnitin-konto. Kun de studerende, der:
-
har sendt mere end én fil til din Turnitin-konto;
-
har indsendt på en måde, der vil tilskrive dem et studie-ID, og
-
har fået en forudsigelsesscore på over 0,57, eller
-
har arbejde, der indeholder mere end 2 flag
Ikke-tilmeldte studerende, studerende, der har brugt Direkte Aflevering, eller studerende, der har brugt Hurtig Aflevering, vises ikke i dashboardet.
Hvem er dashboardet rettet modl?
The Dashboard should be used by academic integrity officers, student conduct officers, or whoever conducts additional investigations into severe cases of academic misconduct at your institution. Anyone using the Dashboard should already know what contract cheating is and be aware of their institution's guidelines and policy on investigating suspected cases of academic misconduct.
When addressing contract cheating it is necessary to take a holistic approach. The Dashboard should be used as part of an existing framework of academic integrity policy and procedures. If your institution does not have a process for investigating and escalating academic misconduct it is recommended that you have an internal discussion about implementing one before you attempt to use the Dashboard.
What is the Dashboard showing me?
The purpose of this Dashboard is to understand the potential scope and scale of academic misconduct at your institution and provide an approach to identify and work with the most at-risk students in order to support a positive forward path.
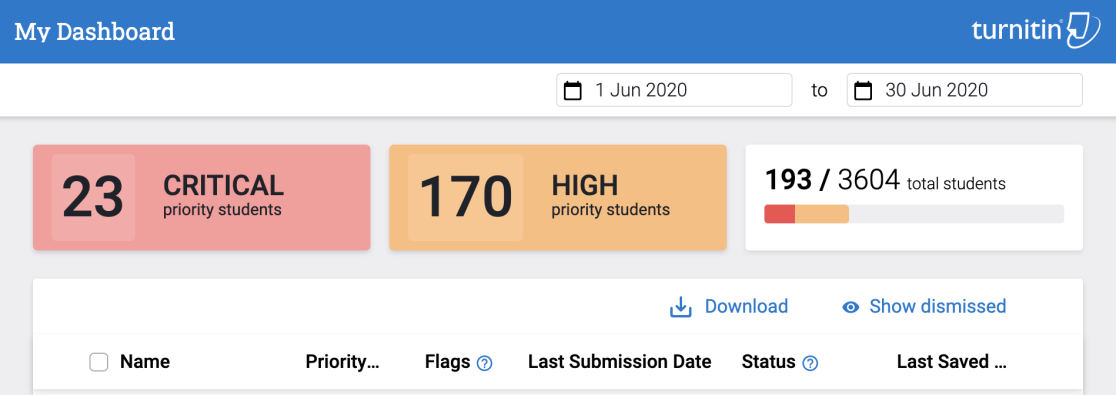
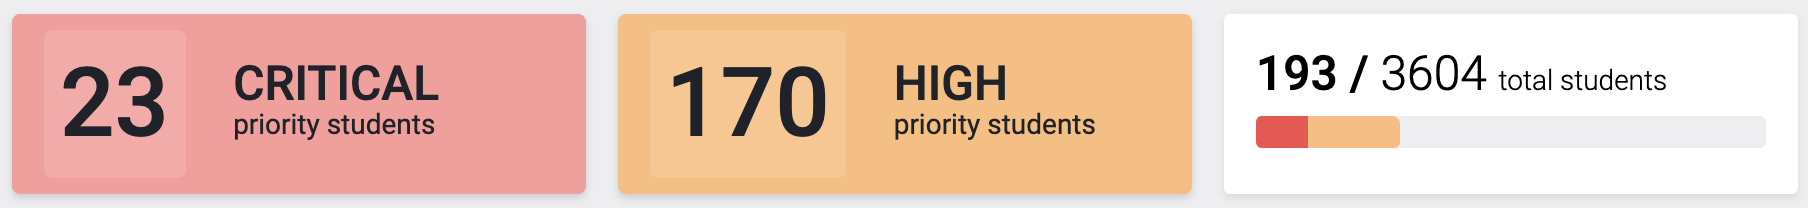
It will show students from your institution whose work has been given a score of 0.57 or higher by our prediction algorithm. The white filter box will show you how many students have been flagged in the Dashboard against the amount of students who have submitted (This will be the dashboard view by default). The orange box will show the number of flagged students who have a score between 0.57 and 0.76 (high priority). The red box will show the number of flagged students who have a score between 0.77 and 1 (critical priority).
For example, the screenshot below shows that 3604 students have submitted to this Turnitin account and 193 have been flagged. These 193 students will be shown in the table body of the Dashboard. Of those 193, 170 are of high priority and 23 are of critical priority.
You can filter the dashboard by date and flag priority.
Learn more about how to use the Dashboard and what the data means.