Your Turnitin guidance is moving!
We’re migrating our content to a new guides site. We plan to fully launch this new site in July. We are making changes to our structure that will help with discoverability and content searching. You can preview the new site now. To help you get up to speed with the new guidance structure, please visit our orientation page .
The main body of the Dashboard shows the students whose submissions have been given a prediction score of 0.573 and above.
Select the row containing the student you want to investigate further to open the report.
The Dashboard body does not show every student that has submitted to your Turnitin account. Only the students who:
- have submitted more than one file to your Turnitin account;
- have submitted in a manner that will attribute a student ID to them, and;
- have been given a prediction score of higher than 0.57, or;
- has work that contains 2 or more flags.
The students can be filtered by threshold or by submission date.
The dashboard has six columns.

Name
The first column contains the name of the student.
The Dashboard only generates reports for papers with student IDs. Non-enrolled students or students who have used Direct Submission or Quick Submit will not appear in the dashboard.
Priority
The second column is the priority of the student based on their prediction score. This will either be Critical, High, or None. Select the question mark next to the column title to learn more about the priority and prediction score as well as the average prediction score of the dashboard.
Flags
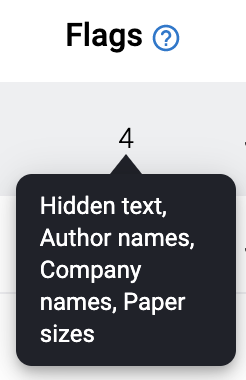
The third column contains how many Flags the report has found.
Flags are visible evidence that a student’s work may not be entirely their own. We alert you when the metadata of a file does not match the student’s information, or if the metadata is different across multiple documents.
The presence of flags is not proof of a different author, but rather a suggestion that a student’s body of work be reviewed.
Hover over the number to see which Flags are highlighted in this report.

Select the question mark next to the column title to learn more about Flags and see the average number of Flags in the Dashboard.
Last Submission Date
The fourth column contains the date of the last submission by this student.
Every time a student submits a new paper the report will regenerate. This will overwrite the previous dashboard report for this student.
Status
The fifth column contains the status of the report. The status reflects the status of the student’s Authorship Report the last time it was saved. Use the status to triage cases and investigate specific students. You must open the report to update the status.
Last Saved By
The last saved by column indicates the last investigator to leave a summary comment or select an investigation status for the Authorship Report.
Download
To download the dashboard as a .csv file, select the download button.

Dismiss a student from the Dashboard
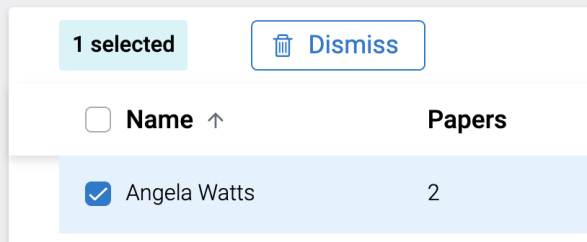
Select the check-box next to the student name to select them. Once selected, a student can be dismissed from the dashboard. You can select and dismiss multiple students at once.

Dismissed students will no longer appear in the dashboard even if future submissions have 2 or more flags or a score higher than 0.57. We recommend only dismissing a student if they have left your institution.
Dismissed papers will not be included in the .csv download.
If you would like to see students that you have dismissed from the Dashboard, select Show dismissed.
Was this page helpful?
We're sorry to hear that.
