Account Statistics
The Account Usage Report shows a high-level overview of usage and similarity statistics for your account for both Turnitin Feedback Studio and Turnitin Draft Coach.
To access the Account Usage Report:
Log into your administrator account for Turnitin.com.
Select the graph icon under the Stats column for the account you would like to view the statistics for.
Set a date range for the statistics you would like to view.
Turnitin Draft Coach statistics will only appear once the product has been configured to your institution's account. To find out how to configure Turnitin Draft Coach, check out our guides.
Setting a date range
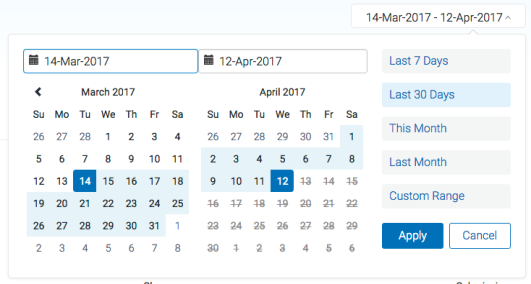
When selecting a date range, you have the option to choose from a set of predefined options or to set your own. Select the date range you want to see statistics for:
To select your own date range, pick your start and end dates from the calendar.
To select a predefined date range, pick your desired range from the options to the right of the calendar.
Select Apply to save the dates you have chosen.

Download a copy of the report
You can download a copy of the Feedback Studio statistical report by selecting the Create CSV Report button.
Select the Create CSV Report button.
You can choose how the data from the report will be organized. Each option will provide you the data by a different aspect of Turnitin and sorted by month. You are able to organize the data to be shown by:
Account - The account you are viewing
Class - Every active class during the period specified
Master Class - Every active master class during the period specified
Instructor - Each instructor who is attached to your account
Integration - Each integration type you have active on your account
Draft Coach - Each statistic available for Turnitin Draft Coach and similarity check percentage range
The report will begin to download in .csv format. You will be able open this in the spreadsheet application of your choice.
Turnitin Feedback Studio
Submissions over time
With the Submissions over time statistic you are able to see the total number of submissions made to your institutional account over the chosen time period. This includes submissions regardless of whether they have a Similarity Report or their grading status.
The Classes with the most submissions section shows the five classes with the most submissions that belong to your account.

High similarity scores
With the High similarity score statistic you are able to view the number of similarity scores that are greater than or equal to your chosen High similarity score threshold. The Most high similarity scores section shows the five classes with the largest number of submissions that received a Similarity Index greater than or equal to the High Similarity Threshold.
If you set the High similarity score threshold to 20%, the table will show the five classes that have the largest number of papers with a Similarity Index equal to or greater than that percentage. If the Natural History class has four papers that match at 20%, 21%, 23%, and 25%, it will appear higher in the table than the Geography class that had three papers matching at 95%, 82%, and 99%.

Submissions with feedback
With the Submissions with feedback statistic you are able to see the classes with the highest number of submissions for a given period and the classes that have the most submissions with feedback amongst other statistical summaries.
The Submissions with Feedback section shows the five classes that have given feedback to the most submissions during the chosen time period.

Common core rubric reports
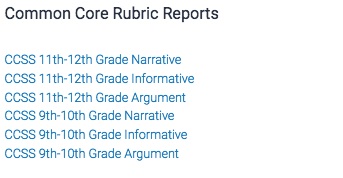
The Common Core Rubric Reports provide detailed statistics about classes that have used Turnitin's Common Core rubrics. Statistics for the Common Core Rubric Reports are available for any six-month or less time period.
For example, 1/1/12 to 6/31/12, 1/1/12 to 1/2/12, or 10/15/16 to 3/14/17. Turnitin only supports data date ranges of 1/1/12 and later.

Turnitin Draft Coach
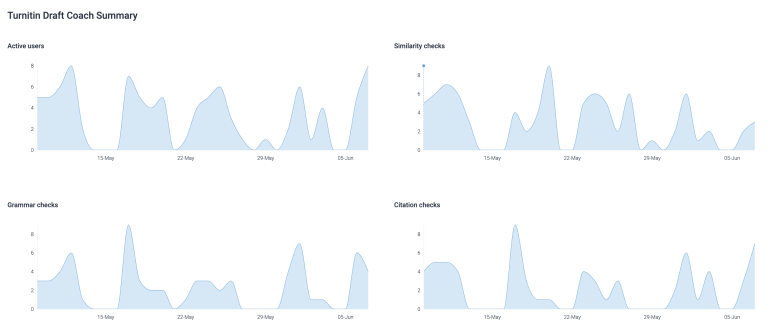
Active student users
With the Active student users statistic you are able to view the number of students who made at least one Similarity, Citation, or Grammar check in the chosen period. A student that has used Draft Coach on multiple documents will be counted as one active student.
Grammar checks
With the Grammar checks statistic you will be able to view the total number of grammar checks during the chosen period. Please remember that students have access to unlimited grammar checks per document.
Similarity checks
With the Similarity checks statistic you will be able to view the total number of Similarity Checks during the chosen period. Please remember that students are limited to three Similarity Checks per document.
Citation checks
With the Citation checks statistic you will be able to view the total number of Citation Checks during the chosen period. Please remember that students have access to unlimited Citation Checks per document.

AI Writing
AI Writing statistics are only available for accounts that have the AI Writing feature as part of their license type and the feature enabled by the account administrator.
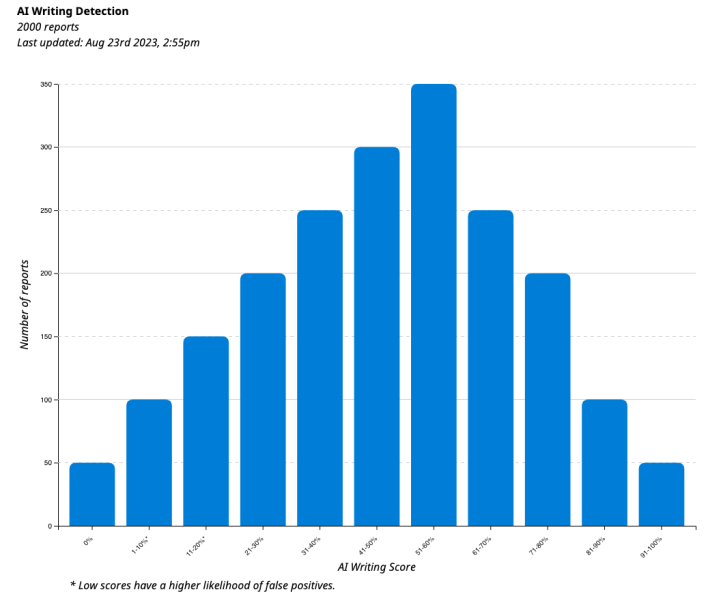
When enabled, the AI Writing chart is visible at the top of the page. This chart is a visual representation of AI Writing scores for documents submitted to the account during the specified date range.
AI Writing statistics take over 24 hours to generate so the ‘Today’ date range will not return any data.

The top of the chart will indicate how many reports are included in the chart along with the date the chart was last updated.
Was this page helpful?
We're sorry to hear that
If you have the time, we'd love to know how we could improve it.
The guide
