Your Turnitin guidance is moving!
We’re migrating our content to a new guides site. We plan to fully launch this new site in July. We are making changes to our structure that will help with discoverability and content searching. You can preview the new site now. To help you get up to speed with the new guidance structure, please visit our orientation page .
Statistics for Turnitin Draft Coach
The Statistics page shows a high-level overview of usage data for your account.
-
Log in to your administrator account and select Statistics from the left side panel.
-
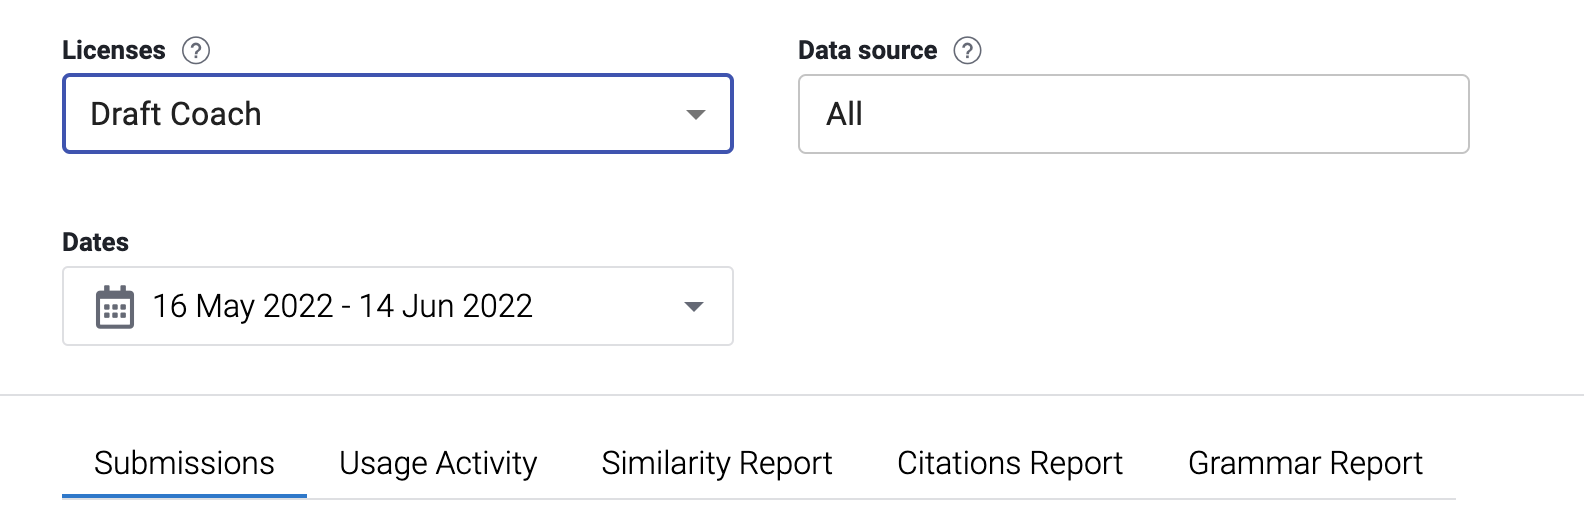
From the Licenses drop-down, select Draft Coach. You can keep the Data source as All.

-
To set a date range for your statistics, select the drop-down date field from the Date range heading. A calendar will pop up.
-
Select your start and end date on the calendar, or use the Date Presets column to choose predefined date ranges.
-
Select Apply.
Now that you have identified Draft Coach and specified your date range, data will be presented in graphs for the following tabs when selected:
-
Submissions - The total number of similarity checks during your specified time period. Remember that users are limited to three similarity checks per document.
-
Usage Activity - This refers to the number of active users during your specified time period. An active user is counted when they run at least one similarity, citation, or grammar check. A user will only be counted once.
-
Similarity Report - A visual representation and breakdown by color of the similarity score ranges per similarity check.
-
Light blue: 0% matching text
-
Dark blue: 1-24% matching text
-
Yellow: 25-49% matching text
-
Orange: 50-74% matching text
-
Red: 75-100% matching text
-
-
Citations Report - The total number of citation checks during your specified time period. Users have an unlimited amount of citation checks per document.
-
Grammar Report - The total number of grammar checks during your specified time period. Users have an unlimited amount of grammar checks per document.
Want to export your statistics?
-
Select the tab of the data report you want to export and then select the Export button on the right of the tabs.
-
Choose to export either a .CSV or .XLSX file. The report may take a moment to export when selected.
-
When the report is ready, a download link will appear at the bottom of your screen. Select the link to download the file to your device.
Was this page helpful?
We're sorry to hear that.
