Your Turnitin guidance is moving!
We’re migrating our content to a new guides site. We plan to fully launch this new site in July. We are making changes to our structure that will help with discoverability and content searching. You can preview the new site now. To help you get up to speed with the new guidance structure, please visit our orientation page .
提出物の統計の表示
-
「管理者設定」ページで、「管理者」サイドパネルから「統計」を選択し、「統計」ページに移動します。
-
「統計」ページで、ライセンスの種類とデータソースを選択し、日付範囲を設定します。
ライセンスの種類、データソース、および日付範囲の選択でサポートが必要な場合は、「アカウント統計へのアクセス」ガイドを参照してください。
-
次に、ライセンス、データソース、日付範囲を設定した状態で、「提出物」タブを選択します。
-
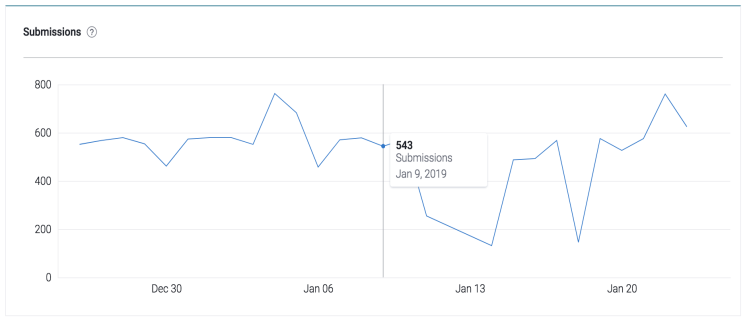
「提出物」タブを選択すると、提出物グラフが表示されます。このグラフは、指定した日付範囲で類似性レポートを正常に生成した提出物を視覚的に表したものです。
-
所属機関が特定の日に Turnitin に提出した提出物の数を表示するには、データ行の上にマウスを合わせて動かすと、グラフの下に表示されている日付に関連する特定の提出物の数のポップアップが表示されます。
Was this page helpful?
We're sorry to hear that.
