Your Turnitin guidance is moving!
We’re migrating our content to a new guides site. We plan to fully launch this new site in July. We are making changes to our structure that will help with discoverability and content searching. You can preview the new site now. To help you get up to speed with the new guidance structure, please visit our orientation page .
Downloading the Administrator Usage Report
The Administrator Usage Report offers school and district administrators a wealth of data on Revision Assistant usage in their school(s). This downloadable Excel report can be used to figure out how many and how often teachers and students are using the Signal Check module, and (most excitingly!) it helps administrators gauge the impact our Signal Check assignments are having on student writing. Click the links below to expand the sections and learn how to download and interpret the Administrator Usage Report.
- Launch Revision Assistant.
- Click Reports in the side panel on the left. This will bring you to the Reports page for your school(s).
- Fill in a start and end date (such as the start and end of a semester).
-
Follow the next steps below based on the type of administrator you are.
4a. I'm a multi-school or district admin...
4b. I'm a single-school admin...
- Keep "Include All" selected to see data for all your schools.
-
Select the Download Excel Report button.
OR
- Click "Select Schools."
- Select schools you want to see data for.
- Select the Download Excel Report button.
- Your school should be the only one you see.
- Select the Download Excel Report button.
The first time you download this report, it may take 30 seconds or so. It will be worth the wait! Promise.
- When your report has downloaded, save it to your computer using a descriptive file name.
- Ta-da! You're ready to start perusing the usage data for your school(s).
The Administrator Usage Report contains five tabs of information on Signal Check module usage: the Report Summary, School Usage, Teacher Usage, Class Usage, and Definitions. Keep reading for an overview of what you'll find on each tab and what it means if you see a zero or a dash.
The Report Summary Tab
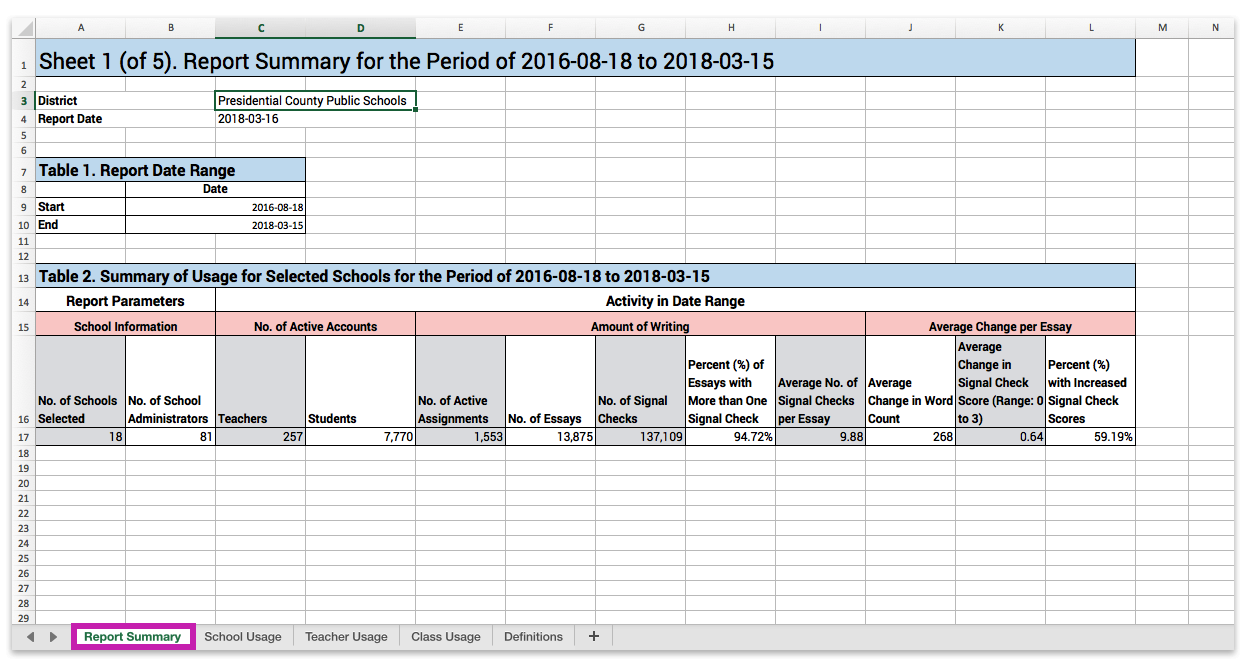
The Report Summary tab gives administrators a high-level look at usage and performance in their school(s) as a whole. This tab displays data such as the total number of teachers, students, active assignments, and essays. Administrators, check out the Average Change per Essay section of this tab to see the overall impact Revision Assistant is having on all the students you work with! Click the image below for a closer look at this tab.
The School Usage Tab
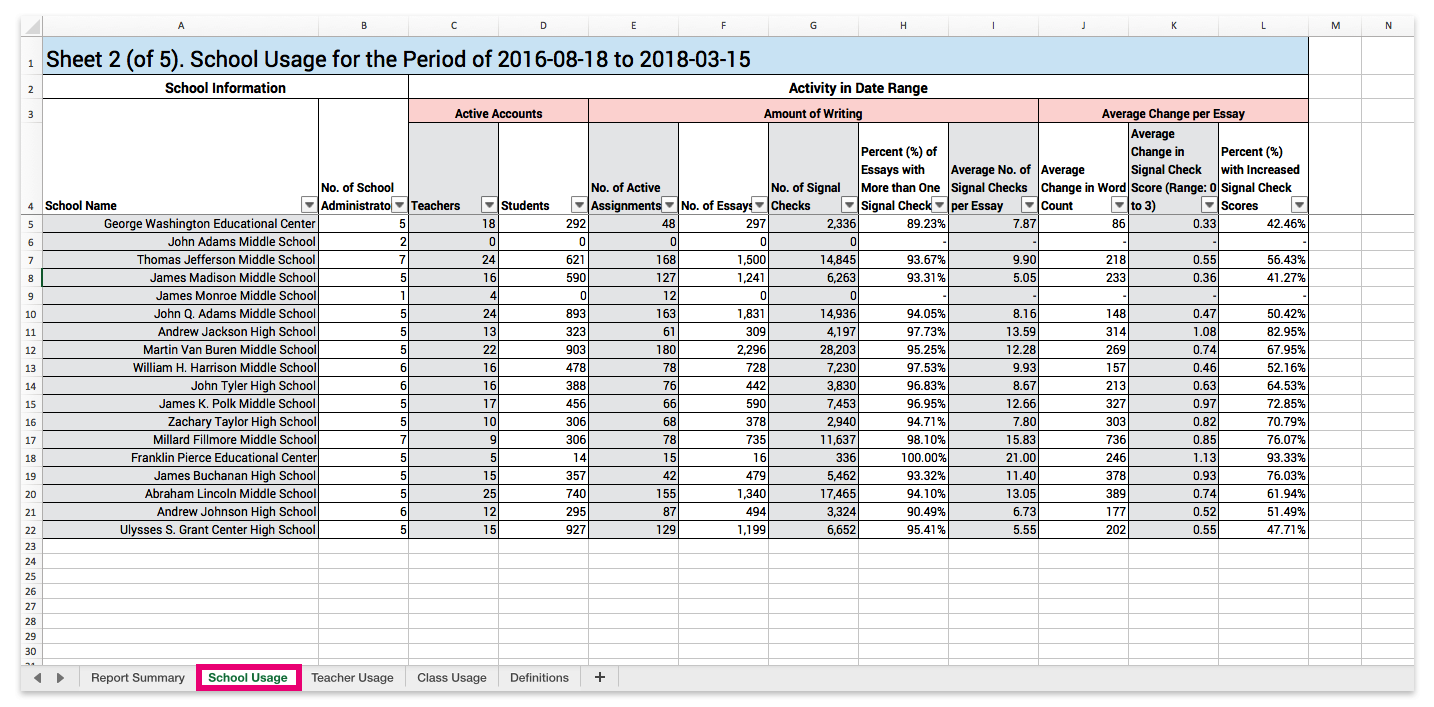
The School Usage tab gives administrators a more in-depth look at usage and performance in their individual school(s). This tab displays data such as the number of teachers, students, essays, and requested Signal Checks per school. Multi-school and district administrators, check out the Average Change per Essay section on this tab to see the impact Revision Assistant is having on students in each one of your schools! Click the image below for a closer look at this tab.
The Teacher Usage Tab
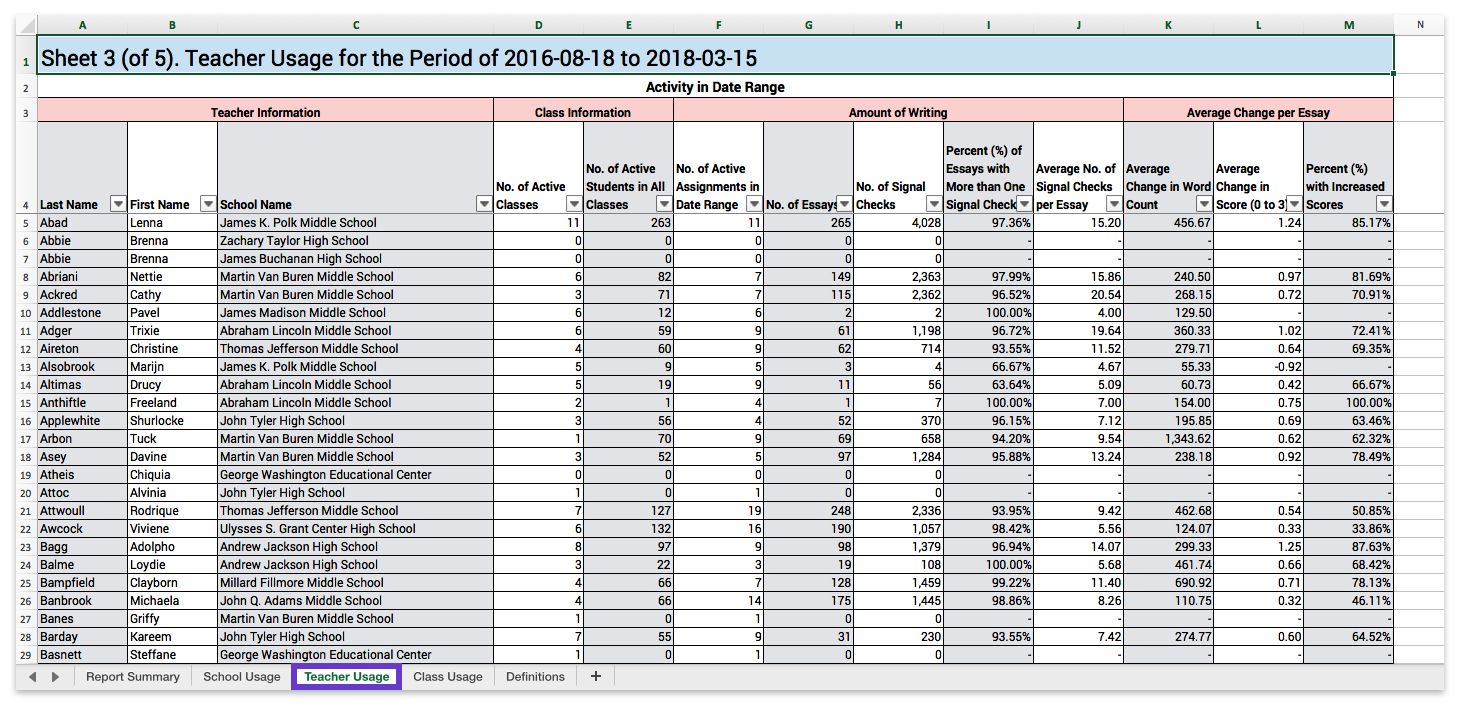
The Teacher Usage tab shows you which teachers in your district or school(s) are actively using Revision Assistant and generally shows how much their students are improving with each Signal Check draft. Check this tab to see who your superstar Revision Assistant teachers are and ask them to share their secrets for Signal Check success at a professional development day or in a department meeting. Click the image below for a closer look at this tab.
The Class Usage Tab
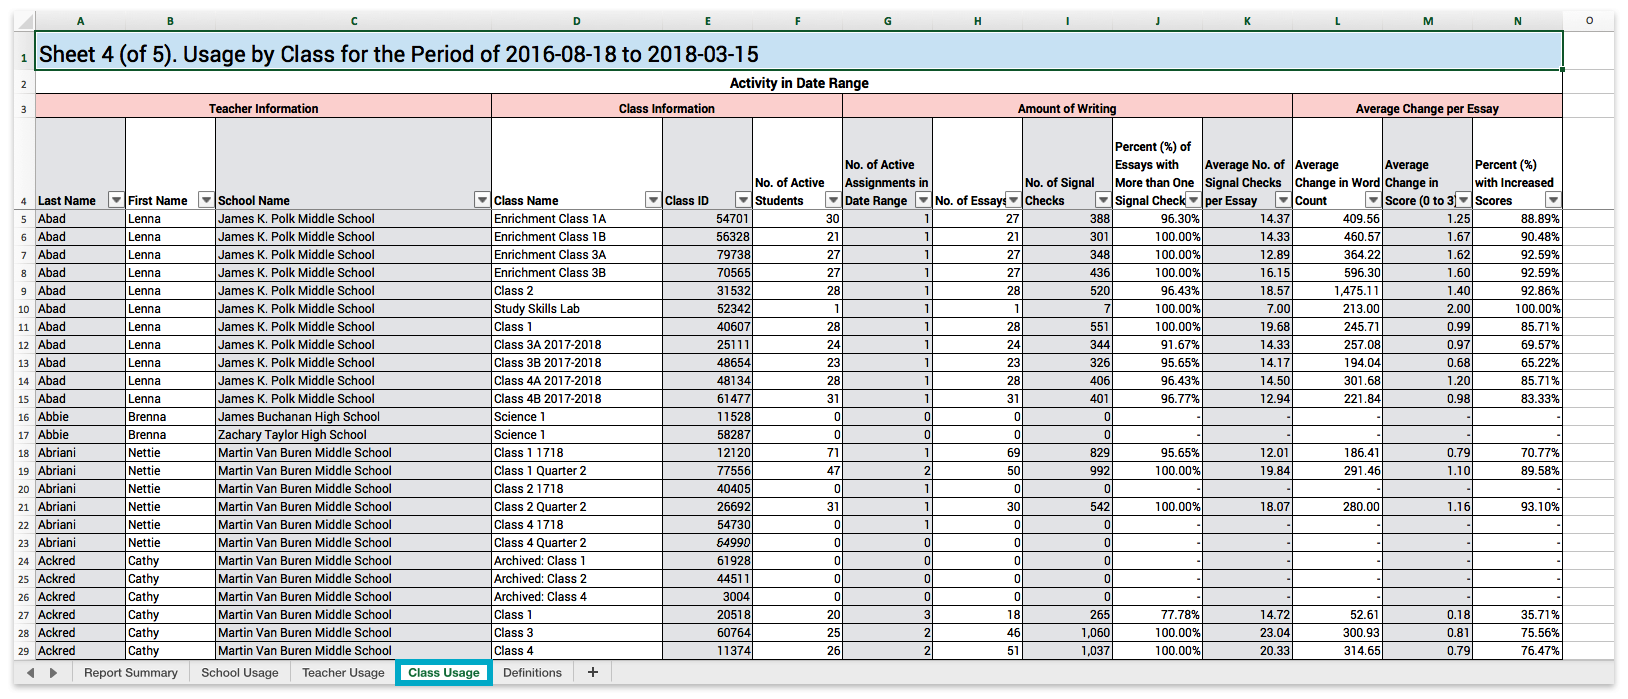
The Class Usage tab digs into the progress every class is making with Signal Check assignments. Are teachers only assigning one Signal Check assignment per class or multiple? Do scores on each draft seem to increase in classes with multiple active assignments vs. classes with one assignment? Are high school classes requesting Signal Check feedback more often than middle school ones? Use this tab to see what usage or progress trends are happening among specific classes in your school(s). Click the image below for a closer look at this tab.
The Definitions Tab
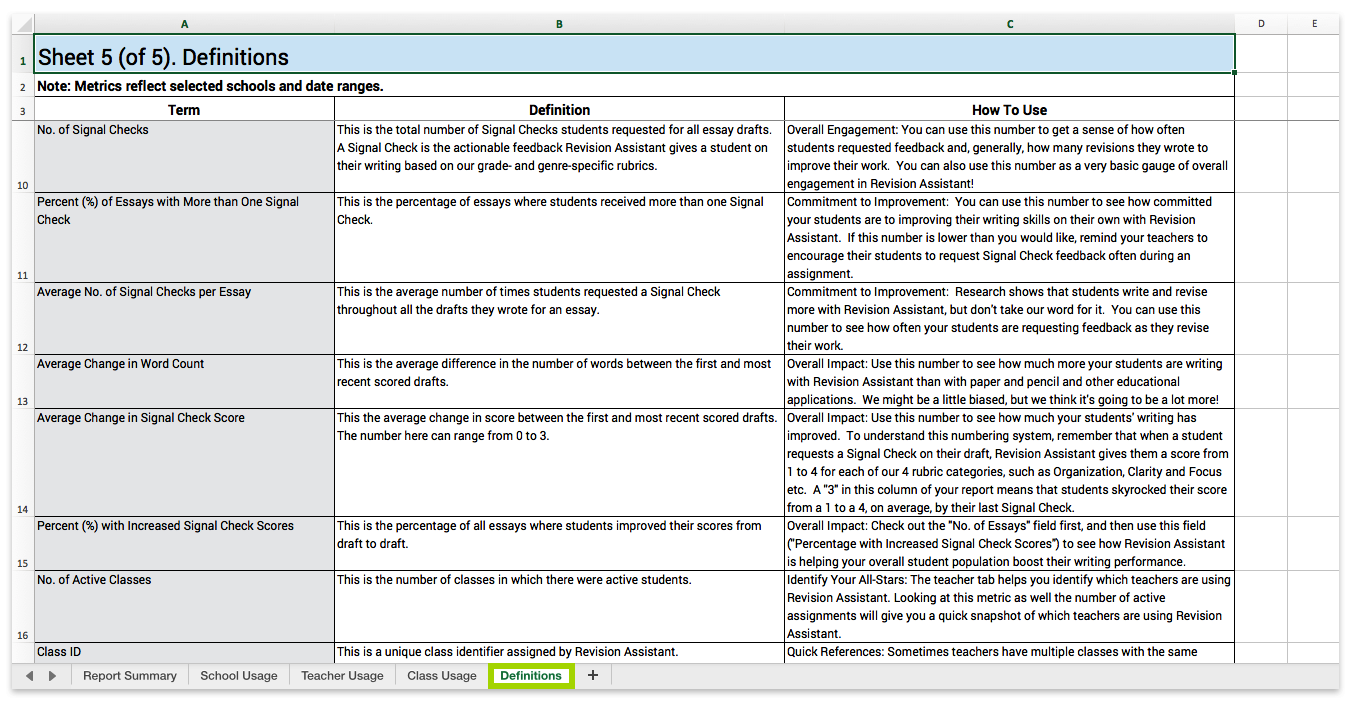
The Definitions tab explains what administrators will find in every field of the Administrator Usage Report. Dive deeper with the How to Use column for tips on how each field of the report helps you gauge the progress your districts and/or schools are making towards achieving their writing goals. Click the image below for a closer look at this tab.
Zeroes & Dashes
The Administrator Usage Report displays counts of certain sets of data and the averages and percentages of others. A dash (-) or a zero might show up in a field on the report. Below are some reasons why.
Zeroes
- A zero in a field means Revision Assistant made a calculation that resulted in a zero.
- Here are some example scenarios below:
|
What field has the zero? |
What causes a zero there? |
|---|---|
|
No. of Active Assignments |
|
|
No. of Essays |
|
|
No. of Signal Checks |
|
|
|
|
Dashes
- A dash in a field means Revision Assistant didn't have enough valid data to make a calculation.
- Here are some example scenarios below:
|
What field has the dash? |
What causes a dash there? |
|---|---|
|
Percentage of Essays with More than One Signal Check |
|
|
Average No. of Signal Checks per Essay |
|
|
Percent (%) with Increased Signal Check Scores |
|
Was this page helpful?
We're sorry to hear that.
